Creating Basic Reports with Basic Business Intelligence (BABI)
Last June we published a blog presenting our Basic Business Intelligence module, a solution that enables the analysis of data within the ERP. This article focuses on how to create a basic report using the templates provided and understand the usefulness of the different configuration fields. We will leave the customization of reports and their configuration for analyzing new data and filters for future publications.
Initially, the Business Intelligence menu only shows two options:
- Configuration: Shows the data for the fields that can be analyzed (Expressions) and the filters applied to the base reports (Filters).
- Reports: Shows the 30 base reports delivered with the module.
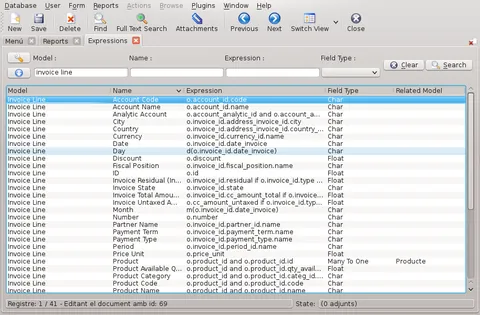
We start with the standard reports found in Reports. Their characteristics are briefly described by their name, model (the OpenERP table from which the data is obtained), a short report description, and the applied filter. We will use the Year/Product/Month report as an example; it shows product sales by year and month based on invoice data.
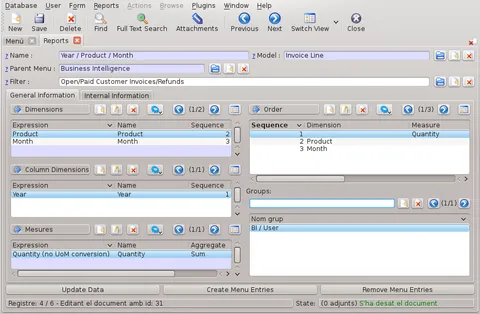
The first step is to create the menu entries. Double-click the Year/Product/Month record and open the report form. There are two tabs and several fields for defining the report parameters, which we will discuss later. For now, we will focus on the three buttons at the bottom:
- Update data: Updates the report data.
- Create Menu Entries: Creates the menu entry for the selected report.
- Remove Menu Entries: Deletes the menu entry for the selected report.
Create the report by clicking Create Menu Entries, then load the initial data with Update Data. Return to the OpenERP main menu and refresh it. A new entry appears under Business Intelligence: the Year/Product/Month report, with the date and time of the last data update in brackets. One of the module's features is that it keeps the latest analyzed data in memory, so it can be consulted immediately when fully up-to-date information is not required.
The report contains two additional entries: one with the same report name, showing all analyzed data in tabular format, and the Update Data Year/Product/Month action, which updates the data directly without opening the report configuration. The tree entry contains the results in hierarchical form.
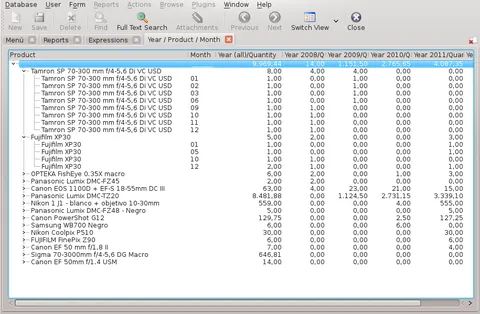
The first column contains the information specified in the Expression table of the configuration screen. The data is sorted and grouped according to the sequence. In this example, the order is Product and Month: the main branches are products, with the months containing sales beneath them. The product row shows the aggregated total sales.
The other columns show the data to be analyzed, defined in the Measures table of the report configuration. In this example, they show the accumulated quantities sold. Since we are also interested in data from different years, we find Year in the Column dimension table.
Before looking at the chart, let us review the two remaining tables in the Report configuration:
- Order: The defined sequence determines how the data is sorted. In this example, products are first sorted by quantity sold, with the best-selling product at the top.
- Groups: Defines the user groups that can view the report.
The Internal Information tab also contains useful information: the Last Update Duration fields show how long the last update took, which is worth checking before loading the data again.
Finally, return to the tree-form data table to visualize the data. Double-clicking a parent displays a chart of its children. The chart is limited to one level: selecting the main branch shows the aggregated sales of all products without monthly detail, whereas selecting a specific product shows the aggregated sales for each month.
The double-click opens a wizard where you can select the chart type—columns or pie—and the data from the Measures table.
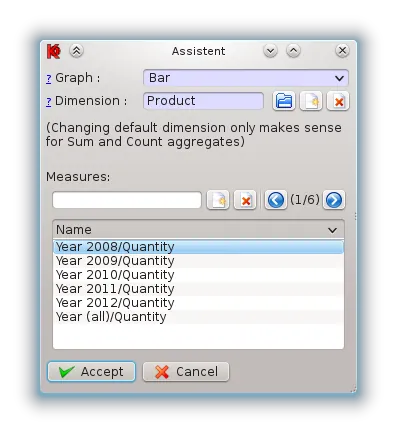
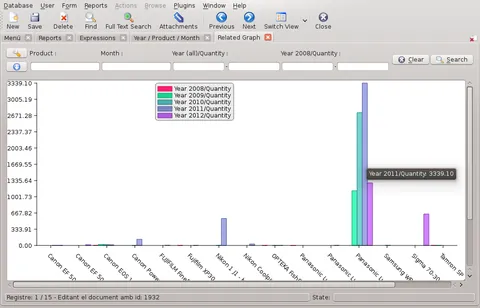
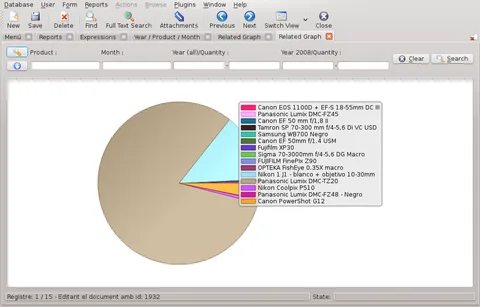
Finally, note that the fields at the top of the chart allow you to filter the information.
In a forthcoming publication, we will explain how to configure basic reports and adapt them to the company's needs.