Customizing reports with Basic Business Intelligence (BABI).
Carles Hilario Oct 29, 2012
This week we continue with the training about BABI, our module of Business Intelligence which was begun in the blog Creating Basic reports with Basic Business Intelligence (BABI).
In this blog we will focus on the 5 fields available for customizing reports and graphs: Dimensions, Column Dimensions, Mesures, Order and Groups. To facilitate the comprehension we will continue with the same example as in the previous blog.
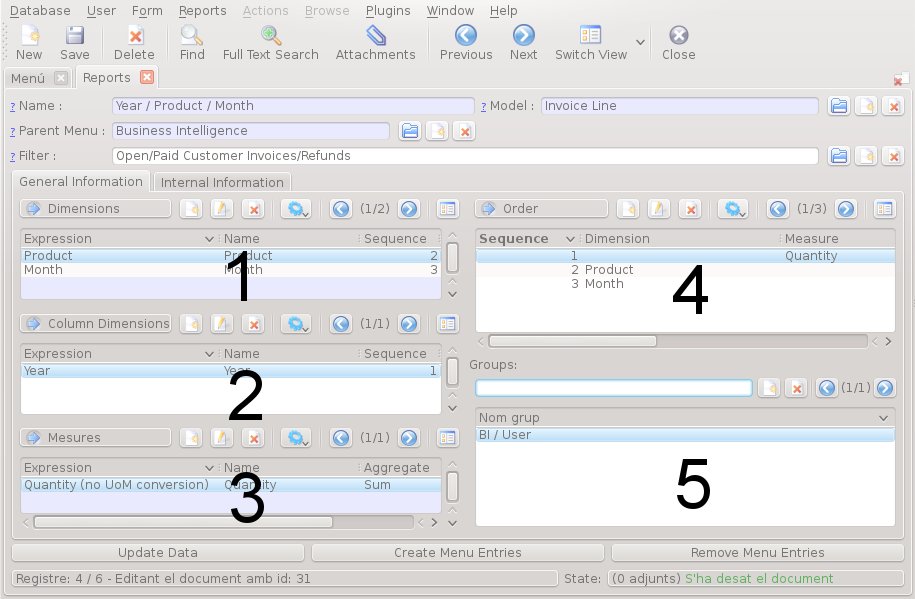
1. Dimensions
This field indicates what information is displayed in rows in the table of data, as well as how to group and order it. The example shows the following sequence:
The main branch show the products and the sales of each month in a second level.
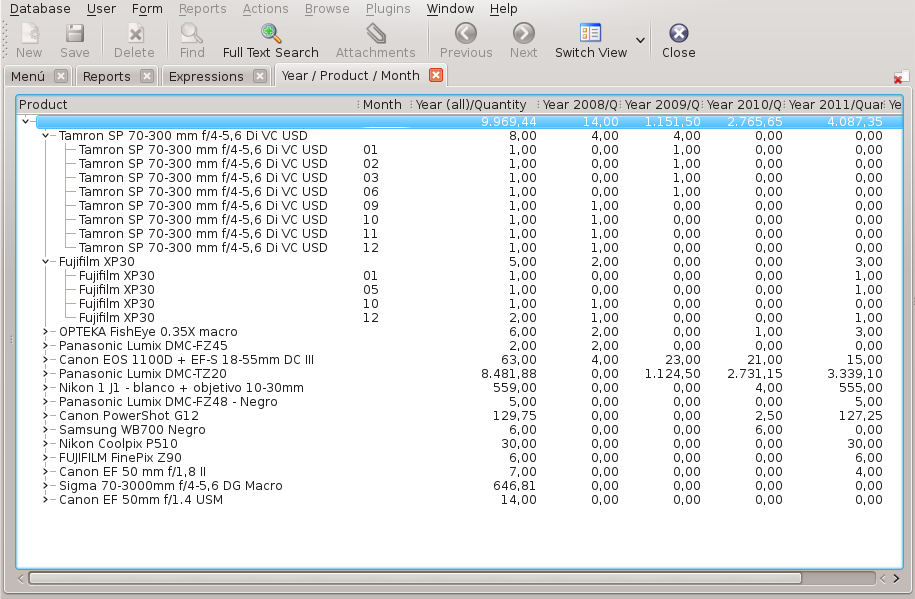
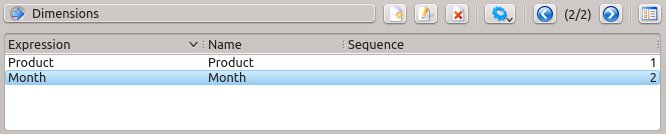
This table allows us to modify the sorting order (Sequence), if we change the order to Month (1) and Product (2) the data tree changes and show the months in the main branch and the products sold in each period in a second level.
We can also add fields in the data source table, adding a new record to the table and assigning the order by sequence number. In the example we could display data such as country, city, payment, discount, etc...
In the creation of the data structure we must consider that the graphics only display data of one level and also we can't make comparisons between different rows. If we want compare some data it should displayed on columns on Column Dimensions.
2. Column Dimensions
This table indicates the information displayed in columns and what you can compare in the graph, the sample shown the year (Year).
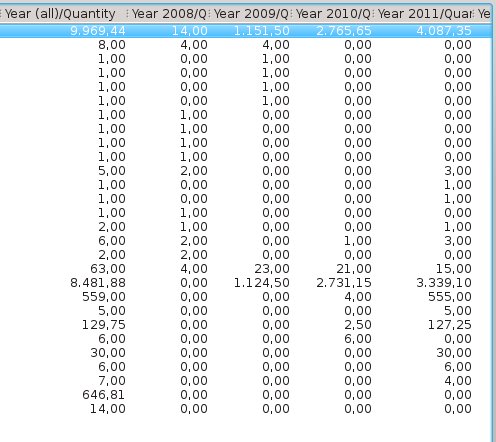
Just as in Dimensions, we can also add fields and arrange them. In this case, the OpenERP limitations doesn't allow us create a data tree for the columns, the information is shown in severals columns, with the aggregate data in first position followed by different columns with specific data field. In the example and recovering the chart above, we see a first column with the aggregate of every year followed by several columns with units sold each year.
3. Mesures
The third table shows what data we want to display and how these will be aggregated: costs, sales, units, etc... As in the previous tables we can add and order more fields that will be displayed as new columns.
We will find a new parameter related to the field: (Aggregate). It defines how the information will be grouped, there are several options:
- Average: The aggregate shows the average values.
- Sum: The aggregate is the sum the displayed values.
- Count: The aggregate shows the number of entries.
4. Order
This table allows us to define the order of the information in the data tree. We can add the expressions Dimension and Mesures of the tables 1, 2 and 3, and indicate the priority order with the sequence number. We have the following sort in the example:
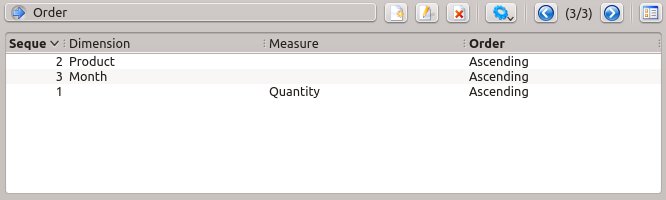
First will sort the data by number, followed by the product name and the month.
We can also define what sort criteria are followed for each concept, with a double click in the column log Order we can select:
- Ascending: Sort the data lowest to highest numerically or alphabetically.
- Descending: Sort the data highest to lowest numerically or alphabetically.
5. Groups
Finally we have the table Groups which allows us to specify the groups or profiles of users who have access to the report. It uses the same user groups defined in OpenERP.